
The average Cherwell home reached a record £360,513 in September, up 2.5% in a year as the South East fell. Cherwell had the fifth fastest rise of 64 areas.
The average home in Cherwell was worth £360,513 in September 2026, the highest figure on record. That is up £8,732 (2.5%) on September 2025. Across the South East, prices fell 0.2% over the same year.
The figures come from HM Land Registry’s UK House Price Index for September 2026, published on 18 November. England as a whole rose 0.8%.
The index figure is a mean average of sold prices, adjusted for the mix of homes sold. It is not a median, and a mean is pulled upwards by the most expensive sales.
A new high for the district
The Cherwell series runs back to 1995. On the revised figures, the previous highest month was May 2026, at £356,233. September beats it by £4,280.
Prices rose 1.0% between August and September alone. The Cherwell average is now:
- £8,732 higher than a year ago
- £19,872 higher than in February 2026, the low point of the past year, at £340,641
(Series: Cherwell, UK HPI, and the September 2026 full data file.)
Fifth in the South East
Of the 64 local authority areas in the South East, Cherwell had the fifth fastest rise. The four ahead of it:
- Epsom and Ewell, 4.1%
- Hart, 3.6%
- Elmbridge, 3.2%
- Canterbury, 2.8%
Prices fell over the year in 35 of the 64. Across all 295 local authority areas in England, Cherwell ranked 81st.
Why the annual rate is slower, though prices are higher
Prices are at a record, yet the annual rate has eased from 2.9% to 2.5%. The reason is last year. In September 2025 the Cherwell average jumped 1.4% in a single month, to £351,781. Every month is compared with the same month a year before, so a strong one then makes this year’s rise look smaller.
August has also been revised. We reported it at £355,981 and 2.6%. The September file puts August at £357,014 and 2.9%, as more completed sales were added.
Here is the annual rate on the latest figures:
- February 2026: -0.3%
- March: +0.8%
- April: +1.8%
- May: +3.7%
- June: +3.7%
- July: +4.3%
- August: +2.9%
- September: +2.5%
What rose, and what did not
| Property type | Average, September 2026 | Change on September 2025 |
|---|---|---|
| Detached | £582,193 | +2.4% |
| Semi-detached | £359,781 | +3.3% |
| Terraced | £297,044 | +2.7% |
| Flat or maisonette | £173,380 | -0.1% |
| All property types | £360,513 | +2.5% |
| First-time buyer purchases | £308,804 | +2.7% |
Source: HM Land Registry UK HPI, Cherwell, September 2026.
Semi-detached homes led again, as they have done since May. Flats were flat, down 0.1%. That is still far better than England, where the average flat fell 3.3% in the year to September.
The first-time buyer average rose 2.7%, a little faster than the market as a whole.
Fewer homes are selling
Sales counts lag the prices by two months. The latest, for July 2026, is 162 sales in Cherwell. In July 2025 there were 197.
June’s count has risen from the 121 we reported last month to 133, as late registrations came in. It is still well below the 211 sales of June 2025.
Cherwell against the neighbours
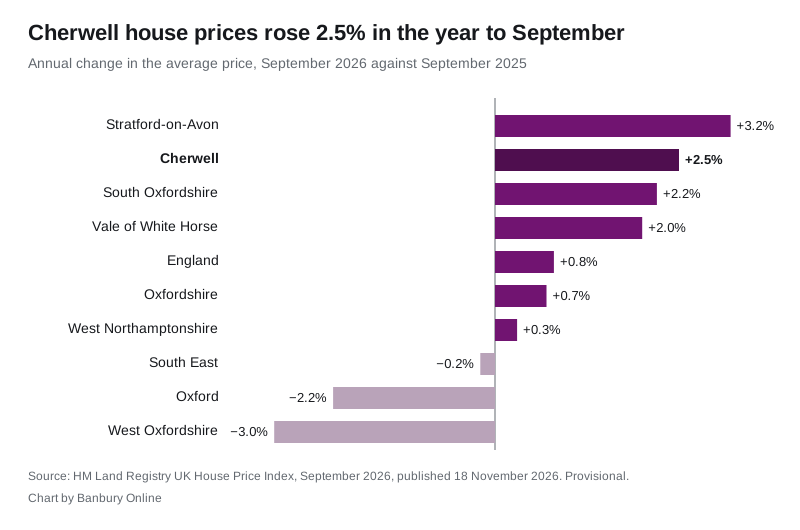
| Area | Average price | Annual change |
|---|---|---|
| Stratford-on-Avon | £398,678 | +3.2% |
| Cherwell | £360,513 | +2.5% |
| South Oxfordshire | £473,592 | +2.2% |
| Vale of White Horse | £410,866 | +2.0% |
| England | £292,998 | +0.8% |
| Oxfordshire | £422,344 | +0.7% |
| West Northamptonshire | £291,387 | +0.3% |
| South East | £378,915 | -0.2% |
| Oxford | £485,743 | -2.2% |
| West Oxfordshire | £422,009 | -3.0% |
Three things stand out:
- Cherwell is now rising faster than any other Oxfordshire district. Last month Vale of White Horse was ahead; it has slowed to 2.0%.
- Cherwell is still the cheapest Oxfordshire district. Its average is £61,831 below the county’s £422,344, and £125,230 below Oxford.
- Stratford-on-Avon district, over the Warwickshire border, rose fastest of the neighbours, at 3.2%. West Northamptonshire, to the north east, is cheaper than Cherwell and almost flat.
Banbury is not Bicester
The district figure hides a split. Our own analysis of Land Registry completed sales, on the Banbury house prices page, found the median sale in Banbury over the year to 30 June 2026 was £290,000, against £346,000 in Bicester.
So a typical Banbury sale sits well under the £360,513 district average, close to the terraced figure.
What it means for you
- If you are selling, the district average has never been higher. But fewer homes are selling than a year ago, so buyers may take their time.
- If you are buying a first home, the first-time buyer average is £308,804, up 2.7% in a year.
- If you are buying a flat, Cherwell flat prices have held level while they fell 3.3% across England.
- Every figure here is provisional. The Land Registry revises recent months as more sales are registered, so expect September to move next month too.
Have your say