
The number of people claiming out-of-work benefits in the Cherwell district rose by 70 in October, to 2,510.
That is 2.3% of residents aged 16 to 64. It is still 70 fewer than in October 2025, a fall of 2.7%. Across the UK the count rose 3.5% over the same 12 months.
The figures are the ONS claimant count, published on nomis on 17 November. It counts people claiming benefits mainly because they are out of work. It is not the unemployment rate, which comes from a survey and runs higher.
Overview
- October 2026: 2,510 claimants in Cherwell, 2.3% of 16 to 64 year olds
- On the month: up 70 from a revised 2,440 in September
- On the year: down 70 from 2,580 in October 2025
- UK: 1,707,320 claimants, up 3.5% on the year, a rate of 3.9%
- Highest local rate: Banbury Ruscote, 4.7%
September has been revised down
When the September figures came out last month, the ONS put Cherwell at 2,490. It has now revised that to 2,440. Monthly figures are often revised like this, and the ONS rounds every count to the nearest 5.
On the revised figures, September’s fall on the year was 115, not the 65 we reported in October. Our September story now carries a note saying so.
The revision also explains part of October’s monthly rise. The year-on-year comparison is the safer one to read.
How Oxfordshire’s districts compare
| District | October 2026 | Rate | Change on the year |
|---|---|---|---|
| Oxford | 3,135 | 2.6% | +120 |
| Cherwell | 2,510 | 2.3% | -70 |
| Vale of White Horse | 1,860 | 2.1% | +20 |
| South Oxfordshire | 1,760 | 1.9% | -30 |
| West Oxfordshire | 1,405 | 1.9% | +75 |
| Oxfordshire | 10,665 | 2.2% | +110 |
Cherwell had the largest fall in the county for the second month running. Oxford and West Oxfordshire both rose.
Where October’s rise came from
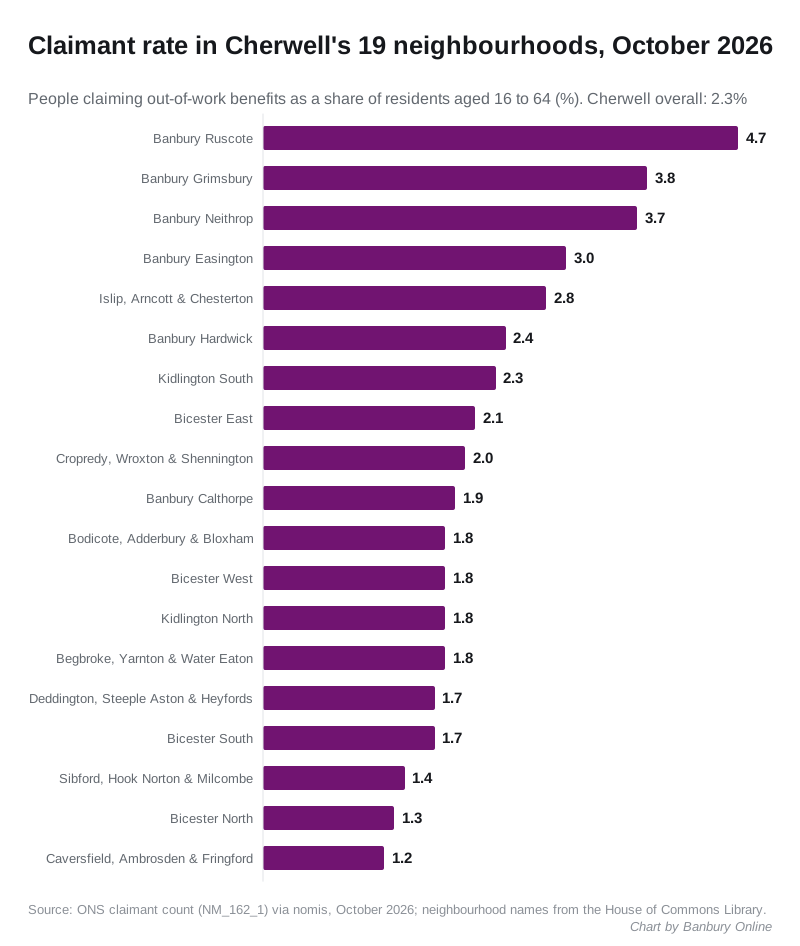
The ONS also publishes the count for 19 neighbourhoods across the district. These are census areas of roughly 5,000 to 15,000 residents, not council wards. The House of Commons Library gives each a local name.
Across those neighbourhoods the count rose by 75 between September and October. Banbury’s six neighbourhoods account for 55 of that rise.
- Banbury Grimsbury: up 30, from 350 to 380, the biggest rise in the district
- Bicester East: up 15, from 95 to 110
- Banbury Ruscote: up 10, from 260 to 270
- Cropredy, Wroxton and Shennington: up 10, from 85 to 95
Grimsbury now has the most claimants of any neighbourhood in Cherwell. Its rate went from 3.5% to 3.8%.
A few areas fell slightly. Kidlington North, Bicester West, Bicester North and Caversfield, Ambrosden and Fringford were each down 5.
Still below February’s peak
Cherwell’s count peaked this year at 2,675 in February. October’s figure is 165 lower.
Most of that fall is still in Banbury. Between February and October:
- Banbury Grimsbury fell from 405 to 380
- Banbury Ruscote fell from 305 to 270
- Caversfield, Ambrosden and Fringford fell from 140 to 100
Ruscote’s rate is down from 5.3% in February to 4.7%. It is still the highest in the district, about twice Cherwell’s rate and above the UK’s.
Younger and older claimants
Claims by 16 to 24 year olds in Cherwell rose from 360 in September to 390 in October. A year earlier the figure was 395, so the younger group is roughly where it was.
There were 610 claimants aged 50 and over, against 585 in October 2025. The over-50s count was higher earlier this year, at 635 in February and May.
What it means for you
For the district as a whole, the jobs picture is still a little better than a year ago, while the country’s is worse.
The month’s rise was concentrated on Banbury’s east side. If you live in Grimsbury, about one working-age adult in 26 is claiming. In Ruscote it is about one in 21. Across Cherwell it is about one in 43.
If you are claiming, or about to, Cherwell District Council lists the help it offers on its benefits pages. Council tax reduction is claimed from the district council, not the DWP.
The November figures are due on 16 December.
Sources
- Office for National Statistics, claimant count (dataset NM_162_1), October 2026 and earlier months: district, county, UK, age and middle layer super output area figures, not seasonally adjusted
- House of Commons Library, MSOA names, for the neighbourhood names
- Our report on the September figures: Cherwell jobless claims fall as the UK rises
Have your say