
The average Cherwell home reached £357,800 in May 2026, up 4.2% on the year against 2.2% in Oxford and a 2.4% fall in West Oxfordshire. Semis rose fastest, flats barely moved.
The average home in Cherwell was worth £357,800 in May 2026, up £14,381 (4.2%) on May 2025, according to the latest UK House Price Index from HM Land Registry. That is the district’s fastest annual rise since April 2025, and it is nearly double the 2.2% rise in Oxford, above the 2.6% county figure, and a long way ahead of West Oxfordshire, where the average price fell 2.4% over the same twelve months.
The May figures were published on 31 July and are the most recent available; the June index is due at 9.30am on Wednesday 19 August. This is a data feature built from the index itself, so a note on what the number is: the UK HPI figure is a mean average of sold prices, adjusted for the mix of homes sold, not a median. A mean is pulled upwards by the most expensive sales, so the typical Cherwell home changes hands for less than £357,800, and in Banbury a good deal less (see below).
What rose, and what did not
The index splits the district’s average by property type. Every kind of house rose by more than 4% over the year. Flats barely moved.
| Property type | Average, May 2026 | Change on May 2025 |
|---|---|---|
| Detached | £578,892 | +4.2% |
| Semi-detached | £357,254 | +5.3% |
| Terraced | £293,661 | +4.4% |
| Flat or maisonette | £172,564 | +0.7% |
| All property types | £357,800 | +4.2% |
| First-time buyer purchases | £306,132 | +4.2% |
Source: HM Land Registry UK HPI, Cherwell, May 2026.
Semi-detached homes led the way at 5.3%, which is the same pattern as England as a whole, where semis rose 4.1% against 2.3% for all homes and flats fell 2.2%. Cherwell’s flats at least held their value, but at 0.7% they added roughly £1,200 in a year while the average detached house added more than £23,000.
The first-time buyer average of £306,132 is the figure the index gives for purchases by people buying for the first time. It has risen at the same 4.2% rate as the market overall, so the gap between what first-time buyers pay and what everyone else pays has not narrowed.
How the year unfolded
The 4.2% headline arrived quickly. A year ago the district was going backwards: the annual change was -1.7% in June 2025 and -2.4% in July 2025, with the average price down at £340,639. It turned positive in September (+2.2%), drifted around 1% to 1.5% through the winter, dipped to +0.5% in February 2026 when the average slipped to £343,491, and then climbed for three months running: +1.5% in March, +2.4% in April and +4.2% in May, when prices rose 1.4% in the month alone. (Monthly figures: Cherwell UK HPI series.)
Part of that is arithmetic. May 2025 was itself a soft month (£343,419), so this May’s number is being compared with a low base. But three consecutive months of widening annual growth is more than a base effect, and the June figures on 19 August will show whether it held.
Fewer homes are changing hands than the price rises might suggest. The index’s sales count lags the price figures by two months; the latest, for March 2026, is 132 sales in the district, compared with 157 in May 2025 and a peak of 250 in August 2025.
Cherwell against the neighbours
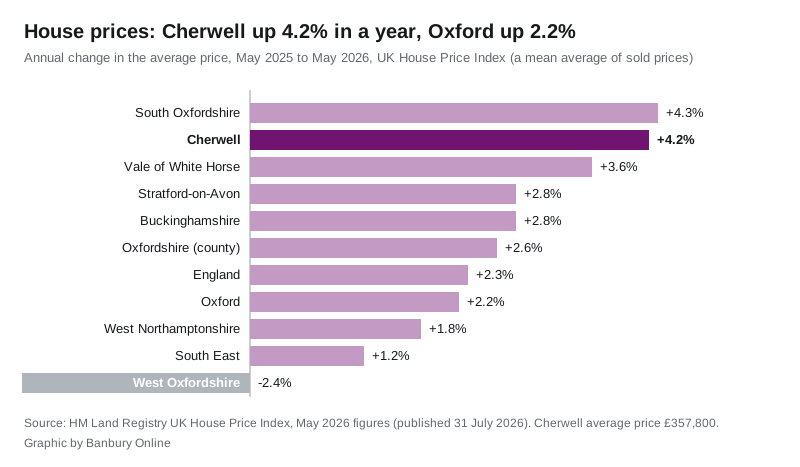
Only South Oxfordshire, at 4.3%, rose faster than Cherwell among the areas around us. The full picture, all from the same May 2026 index:
| Area | Average price | Annual change |
|---|---|---|
| South Oxfordshire | £470,720 | +4.3% |
| Cherwell | £357,800 | +4.2% |
| Vale of White Horse | £407,966 | +3.6% |
| Stratford-on-Avon | £392,880 | +2.8% |
| Buckinghamshire | £485,824 | +2.8% |
| Oxfordshire | £418,038 | +2.6% |
| England | £292,095 | +2.3% |
| Oxford | £473,467 | +2.2% |
| West Northamptonshire | £292,495 | +1.8% |
| South East | £381,311 | +1.2% |
| West Oxfordshire | £417,246 | -2.4% |
Two things stand out. Cherwell is still the cheapest of the five Oxfordshire districts by some distance: about £60,000 below Oxfordshire’s £418,038 average and £116,000 below Oxford. Across the northern border, West Northamptonshire is both cheaper (£292,495) and slower (1.8%), while Stratford-on-Avon district is dearer than Cherwell but rising at only 2.8%. West Oxfordshire’s fall is the odd one out: it was the only Oxfordshire district in negative territory in May, and its flats were down 5.3% on the year.
Banbury is not Bicester
The district figure hides a split that matters more to anyone actually buying here. Our own analysis of Land Registry completed sales, on the Banbury house prices page, found the median sale in Banbury over the year to 30 June 2026 was £290,000, against £346,000 in Bicester, a £56,000 gap. So the £357,800 district average is pulled up by Bicester, Kidlington and the villages; a typical Banbury sale sits well under it, and closer to the terraced average than the all-types one.
What it means for you
- Selling in Cherwell: the 12 months to July 2025 were negative for the district; the 12 months to May 2026 added 4.2%, or £14,381 on the average home. Semis have done best, and if yours is one, the index says it gained 5.3%.
- Buying: the index’s first-time buyer average is £306,132, so a 10% deposit is now a shade over £30,600 on the average first purchase, up from about £29,400 a year earlier when the figure was £293,834.
- Flat owners: you have been left behind, at 0.7% growth against 4.2%. That is a national pattern (flats fell 2.2% across England), not a Cherwell one.
- Watch 19 August: the June index will tell us whether the spring surge lasted into summer. We will report the district figure when it lands.
- What is being built: the supply side of this is on our Banbury planning news page, and the district’s developer-money position is in our report on the £19.7m of Section 106 funds Cherwell holds.
Sources: HM Land Registry, UK House Price Index, May 2026 (published 31 July 2026), district and regional series via the UK HPI open data service; ONS, house prices in Cherwell.
Have your say