
The average Cherwell home hit £356,935 in July, up 4.7% in a year, while the South East rose 0.2%. Only Vale of White Horse grew faster in the region.
The average home in Cherwell was worth £356,935 in July 2026, up £15,868 (4.7%) on July 2025. That is the district’s fastest annual rise since April 2025.
The figures come from HM Land Registry’s UK House Price Index for July 2026, published on 16 September. Across the South East the average rose just 0.2%. England managed 1.1%.
Of the 64 local authority areas in the South East, only one rose faster than Cherwell: its Oxfordshire neighbour, Vale of White Horse, at 5.7%. Out of 295 local authority areas in England, Cherwell ranked 44th.
A note on what the number is. The index figure is a mean average of sold prices, adjusted for the mix of homes sold. It is not a median. A mean is pulled upwards by the most expensive sales, so a typical Banbury sale is well below it (more on that below).
What rose, and what did not
Every type of house rose by more than 4%. Flats rose by less than 2%.
| Property type | Average, July 2026 | Change on July 2025 |
|---|---|---|
| Detached | £576,658 | +4.3% |
| Semi-detached | £356,040 | +5.6% |
| Terraced | £294,142 | +5.2% |
| Flat or maisonette | £171,749 | +1.7% |
| All property types | £356,935 | +4.7% |
| First-time buyer purchases | £305,642 | +4.9% |
Source: HM Land Registry UK HPI, Cherwell, July 2026.
Semis led, as they did in May. Terraced homes are close behind, at 5.2%.
Cherwell’s flats are still growing, which is more than can be said nationally. Across England the average flat fell 3.5% over the same year, while semis rose 2.7%.
The first-time buyer average rose 4.9%, slightly faster than the market as a whole. That is the wrong way round for anyone saving a deposit.
How close to a record
The highest average the index has ever recorded for Cherwell, in a series running back to 1995, is £357,170 in May 2026. July is £235 below it, the second highest month on record.
The annual rate has now risen for five months in a row:
- February 2026: 0.0%
- March: +0.7%
- April: +1.8%
- May: +4.0%
- June: +4.1%
- July: +4.7%
Part of that is a low starting point. In July 2025 the district average was £341,067 and prices were down 2.4% on the year, so this July is being compared with a weak month.
Fewer homes are changing hands. Sales counts lag the prices by two months, and the latest, for May 2026, is 116 sales. That is down from 157 in May 2025, and the fewest in any month since April 2025, when there were 93. (Series: Cherwell UK HPI, July 2025 to July 2026.)
The earlier figures have been revised
The Land Registry keeps adding completed sales to past months, so each month’s first figure is provisional. Two Cherwell months have moved:
- May 2026 was first published as £357,800 (+4.2%). It is now £357,170 (+4.0%).
- June 2026 was first published as £353,632 (+3.8%). It is now £354,546 (+4.1%).
Our May report used the first May figures. It also gave March at +1.5% and April at +2.4%; the July file now puts those two months at +0.7% and +1.8%. The direction of travel has not changed.
Cherwell against the neighbours
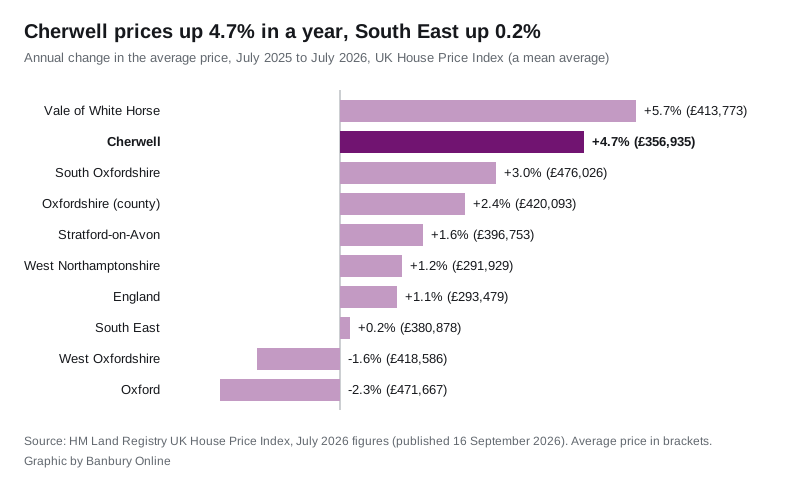
All figures below are from the same July 2026 index.
| Area | Average price | Annual change |
|---|---|---|
| Vale of White Horse | £413,773 | +5.7% |
| Cherwell | £356,935 | +4.7% |
| South Oxfordshire | £476,026 | +3.0% |
| Oxfordshire | £420,093 | +2.4% |
| Stratford-on-Avon | £396,753 | +1.6% |
| West Northamptonshire | £291,929 | +1.2% |
| England | £293,479 | +1.1% |
| South East | £380,878 | +0.2% |
| West Oxfordshire | £418,586 | -1.6% |
| Oxford | £471,667 | -2.3% |
Three things stand out:
- Cherwell is still the cheapest Oxfordshire district. Its average is £63,158 below the county’s £420,093, and £114,732 below Oxford.
- The south and west of the county are going the other way. Oxford and West Oxfordshire are the only two Oxfordshire districts where prices fell.
- Over the northern border, growth is slower. West Northamptonshire is cheaper than Cherwell and rising at 1.2%. Stratford-on-Avon district is dearer and rising at 1.6%.
The rise is not a regional pattern. In the South East as a whole, 26 of the 64 local authority areas saw prices fall over the year.
Banbury is not Bicester
The district figure hides a split that matters to anyone buying here. Our own analysis of Land Registry completed sales, on the Banbury house prices page, found the median sale in Banbury over the year to 30 June 2026 was £290,000, against £346,000 in Bicester.
So a typical Banbury sale sits well under the £356,935 district average, and much closer to the terraced figure.
What it means for you
- Selling: on the index, the average Cherwell home gained £15,868 in the year to July. Semis did best at 5.6%, terraces next at 5.2%.
- Buying for the first time: the first-time buyer average is £305,642. A 10% deposit on that is about £30,560, up from about £29,130 a year ago, when the average was £291,251.
- Owning a flat: Cherwell flats rose 1.7%, well behind houses but ahead of England, where flats fell 3.5%.
- Budgeting beyond the price: council tax by band and parish is on our Cherwell council tax bands page.
- Next release: the August index is due in October. We will report the district figure when it lands, including any revision to July.
Sources: HM Land Registry, UK House Price Index, July 2026 (published 16 September 2026); district, county and regional figures and the South East and England rankings from the UK HPI full data file for July 2026.
Have your say